The Statistics section in the panel shows revenue and occupancy data for the selected apartment. You'll find it in the left menu — the chart icon.
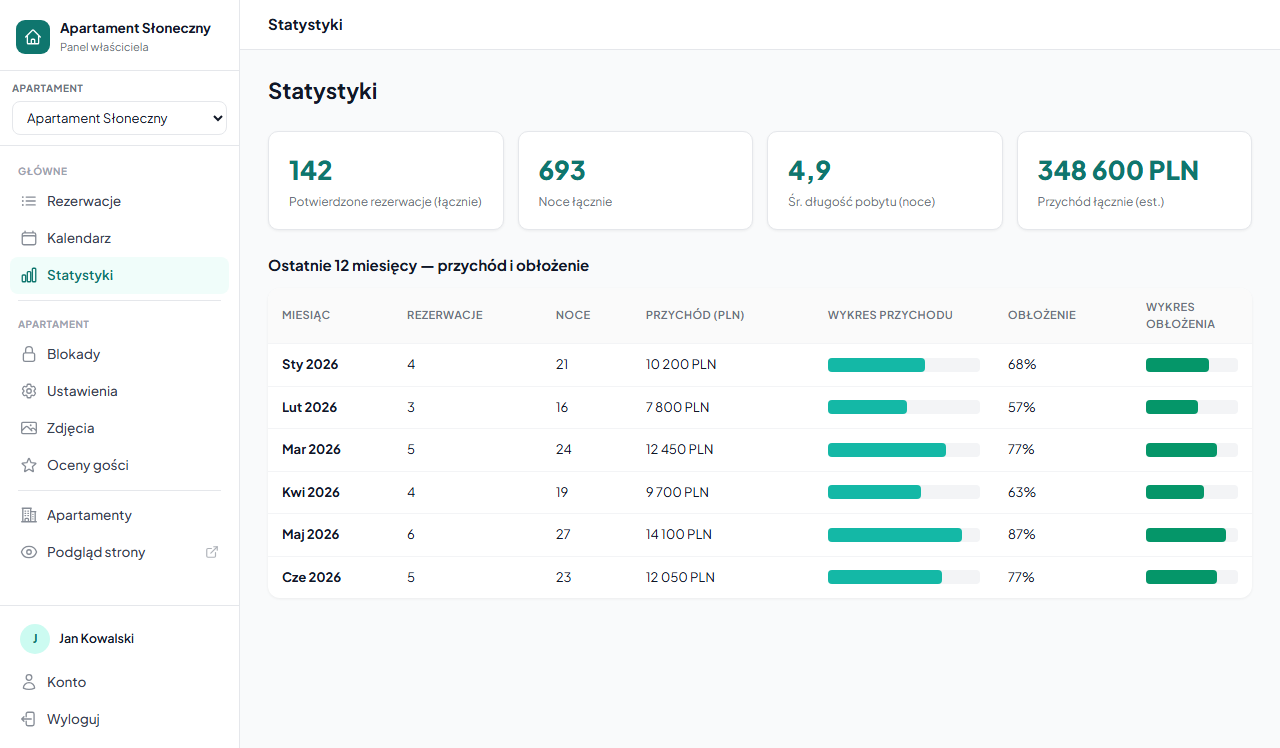
KPI indicators
At the top of the page there are four cards with key figures for the entire history of the selected apartment (not just the last 12 months):
| Indicator | What it means |
|---|---|
| Confirmed bookings | Total number of bookings with the "Confirmed" status since the apartment was created |
| Total nights | The sum of all nights across all confirmed bookings |
| Avg. stay length | The average number of nights per booking (total nights ÷ number of bookings) |
| Total revenue | The sum of the amount fields across all bookings; if the amount wasn't given — the system estimates it as nights × base_price |
The revenue indicator is an estimate — it accounts for amounts entered in bookings or calculated from the base price. If you manually edited prices on bookings, the figure may not match actual revenue.
Price suggestions
Below the KPI cards a "💡 Price suggestions for the coming months" box may appear — the system compares upcoming months with the occupancy a year earlier and suggests where to consider a price increase and where a promotion. The box appears only when the apartment has historical data from comparable months. The details are described in a separate article: Price suggestions.
Monthly table
Below the KPIs you'll find a table summarizing the last 12 months (the current one + 11 previous). Each row corresponds to one month:
| Column | What it shows |
|---|---|
| Month | The short month name and year, e.g. Jan 2025 |
| Bookings | The number of confirmed bookings with check-in in this month |
| Nights | The sum of nights across all bookings in this month |
| Revenue (PLN) | The total booking amount for this month; — when there are no bookings |
| Revenue chart | A proportional bar — the highest revenue = 100% of the bar width |
| Occupancy | The percentage of the month's days occupied by confirmed bookings |
| Occupancy chart | An occupancy bar on a 0–100% scale |
How occupancy is calculated
Occupancy = (booking nights) ÷ (number of days in the month) × 100%.
Example: 18 nights in a 30-day month = 60% occupancy.
If one booking starts in December and ends in January — all nights count toward the check-in month. The check-out month doesn't get any nights from that booking.
Occupancy can exceed 100% only when booking dates overlap (which shouldn't happen with correct configuration).
Data for multiple apartments
If you have several apartments, the statistics show data for only the selected property. Switch the apartment using the selector at the top of the sidebar — the page refreshes with the new apartment's data.
There's no combined view for all apartments at once — you analyze each separately.
Data export
The statistics on this page are read-only — you can't export them directly. If you want to analyze the data in a spreadsheet, use the export of bookings to CSV in the Bookings section — it includes a full list of bookings with dates, amounts and guest counts.
Related articles: Price suggestions · Export bookings to CSV · Owner panel overview · How the booking process works